
Rockport, TX Short-Term Rental ADR Analysis Dashboard
Rockport, TX Short-Term Rental ADR Breakdown
| Tier | ADR |
|---|---|
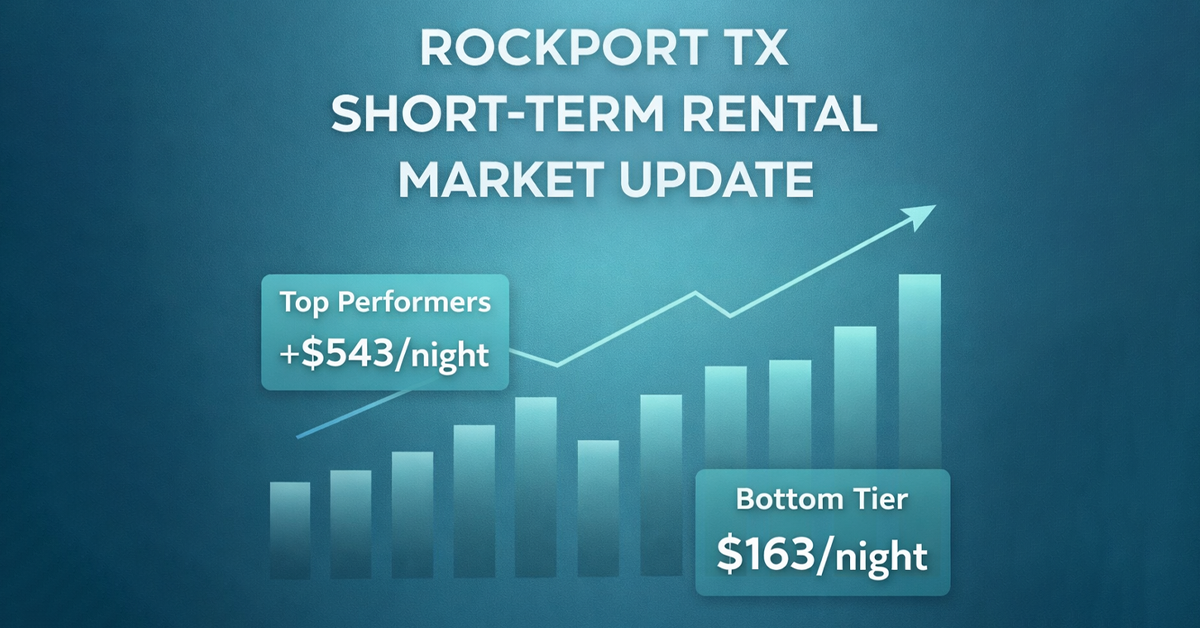
| Bottom 25% | 163 |
| Median | 234 |
| Average | 301 |
| Top 10% | 543 |
Seasonal Performance Analysis
Peak Season
March, June, July
$312/night
$4,304
Low Season
Jan, Nov, Dec
$254/night
$2,404
Best Month (July)
$321/night
$4,997
48%
| Month | ADR | Monthly Revenue | Occupancy |
|---|---|---|---|
| Best Month (July) | 321 | 4997 | 48 |
| Lowest Month (January) | 264 | 2039 | 24 |
Dashboard Summary
Rockport, TX Short-Term Rental ADR Dashboard Summary
Overview
This report breaks down short-term rental performance in Rockport from February 2025 through January 2026, highlighting how pricing, occupancy, and seasonality impact real income potential.
One of the most important takeaways: there is a wide performance gap across the market, with a spread of nearly $380 per night between top-performing and lower-tier properties. That gap isn’t random—it’s driven by location, amenities, presentation, and overall guest experience.
At the high end, well-positioned properties are producing strong seasonal revenue, with July standing out as the peak month, approaching $5,000 in monthly income at roughly 48% occupancy. Even during slower months, the market shows resilience, with pricing holding steadier than many would expect for a coastal destination.
Key Performance Metrics
ADR Tier Distribution
- Average ADR: $301/night (mid-to-upper tier performance)
- Median ADR: $234/night (22% below average)
- Top 10%: $543+/night (more than double lower-tier rates)
- Bottom 25%: $163/night
This spread highlights a highly segmented market where property quality and positioning directly impact income potential.
Seasonal Revenue Patterns
Peak Season (March, June, July)
– Average ADR: $312/night
– Monthly revenue: $4,304
– Driven by summer vacation demand and coastal tourism
Low Season (January, November, December)
– Average ADR: $254/night
– Monthly revenue: $2,404
– Only a 19% drop in ADR, showing pricing stability even during slower periods
Performance Benchmarks
– Best Month (July): $321/night ADR · $4,997 revenue · 48% occupancy
– Lowest Month (January): $264/night ADR · $2,039 revenue · 24% occupancy
– The key insight here is that revenue changes are driven more by occupancy than pricing. Even with relatively stable nightly rates, fewer bookings in the off-season significantly impact total income.
Strategic Insights
Market Positioning Matters
The gap between median and top-tier properties shows that not all homes compete equally. Properties that perform best typically offer:
- Waterfront or water-access locations
- Updated interiors and strong visual presentation
- Amenities that enhance the guest experience
- Occupancy Drives Revenue
Revenue Drivers
While pricing remains relatively stable throughout the year, occupancy is the biggest driver of income swings.
For example, July sees roughly 50% higher occupancy than January. This results in nearly 60% more revenue, even though ADR only changes modestly.
This makes booking strategy and marketing just as important as pricing.
Recommendations
Tier-Specific Strategies
- Bottom 25%: Focus on efficiency, competitive pricing, and small upgrades that improve booking appeal
- Median Properties: Improve positioning through branding, photos, and targeted upgrades to move into higher tiers
- Top 10%: Maintain premium pricing, invest in guest experience, and protect positioning
Seasonal Optimization
- Peak Season: Maximize revenue with dynamic pricing and minimum stay requirements
- Shoulder Season: Balance pricing and occupancy with flexible strategies
- Low Season: Focus on increasing bookings through extended stays and targeted promotions
Data Foundation
This analysis is based on AirROI data from February 2025 through January 2026, combining ADR trends, seasonal performance, and occupancy benchmarks to provide a clear picture of how the Rockport short-term rental market is performing today.